Editor’s Note: You can find the data set and infographic summarizing our findings here but we suggest that you read this article first for context.
In September 2023, The Washington Post’s Courtland Milloy noted, “When D.C. schools’ test scores were announced recently, there was that gap again: the so-called racial achievement gap. Actually, it was more like a chasm.” And indeed, The Partnership for Assessment of Readiness for College and Careers (PARCC) scores showed significant racial disparities between White and Black students’ achievement in both literacy and math assessments. The performance gap between White and Black students is frequently studied–but what about the performance gap within the Black student population itself?
The Black Student Performance Gap
Consider the paths of two fictional DC public school students, Imani and Elijah. Both students come from similar socioeconomic backgrounds. Both live with their mothers and siblings and enjoy sports and music. Imani lives in Ward 8, and Elijah lives in Ward 5, only about 10 miles apart. Though their demographic profiles are similar, unfortunately, their academic achievement and post-secondary preparation couldn’t be more different.
What makes some Black students more likely to succeed than their peers? While that’s a complex, multifaceted question, data collected from DC Public Schools can help us better understand some of the systemic factors influencing Black students’ academic achievement. Performance data from the 2022-2023 school year, reviewed alongside data points like teacher retention, teacher diversity, and chronic absenteeism, paints a picture of two rather different potential school experiences for Black students. Ultimately, these experiences may contribute to vastly different outcomes for students, academically and beyond.
The DC School Report Card uses a measure called student group score (0-100 scale) to measure student performance within schools. According to the DCPS guide, the student group score takes into account a variety of data points, including measures like standardized assessment scores, college and career readiness, and rates of student growth.
While Imani and her family care about her education, she’s faced some challenges–both inside school and out–that Elijah hasn’t. As a result, while Elijah’s student group score is an 81, Imani’s is a 23: nearly a 60 point difference.
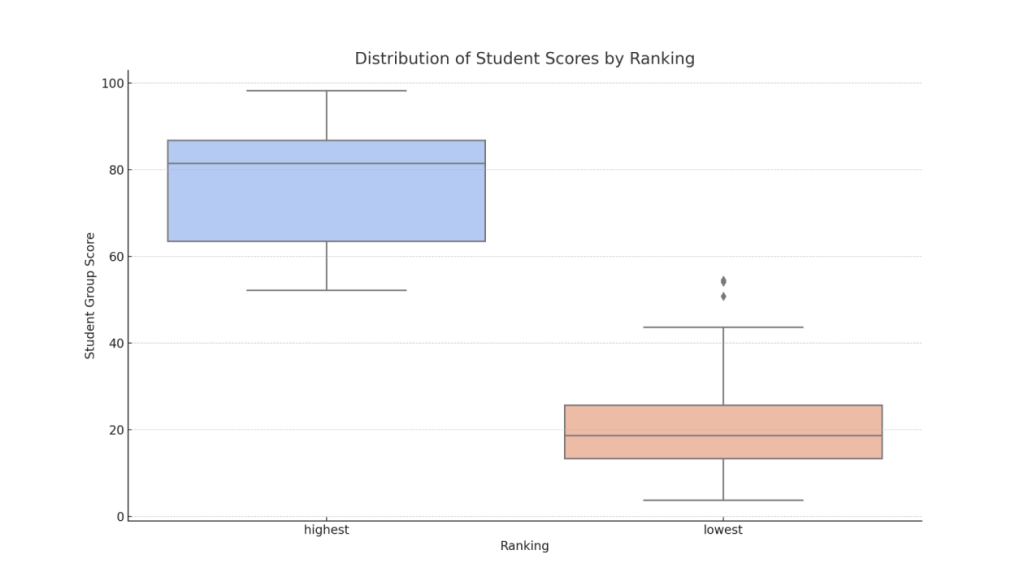 Figure 1. Distribution of Student Scores by Ranking: Box plot showing the distribution of student group scores by ranking. The highest ranked groups (blue) have higher median scores and less variability compared to the lowest ranked groups (orange). Whiskers represent the range within 1.5 times the interquartile range (IQR), with outliers shown as individual points.
So, while it’s important to address the continued achievement gap between Black and White students in the District, it’s also critical for educators and administrators to better understand the factors contributing to the Black performance gap so that effective interventions can be planned and implemented.
Geographic Gap Analysis
Interestingly, the Black student performance gap isn’t consistent across the District. Median high-ranking scores and median low-ranking scores illustrate significant differences by ward.
The bivariate choropleth map below visualizes the mean performance of low-ranking versus high-ranking Black students across different wards in a geographic region. The x-axis of the color palette represents low-ranking student performance, increasing from left to right, while the y-axis represents high-ranking student performance, increasing from bottom to top. Each ward is shaded according to the combined performance scores of these two groups.
Bivariate of High Ranking vs Low Ranking African-American Students by Ward
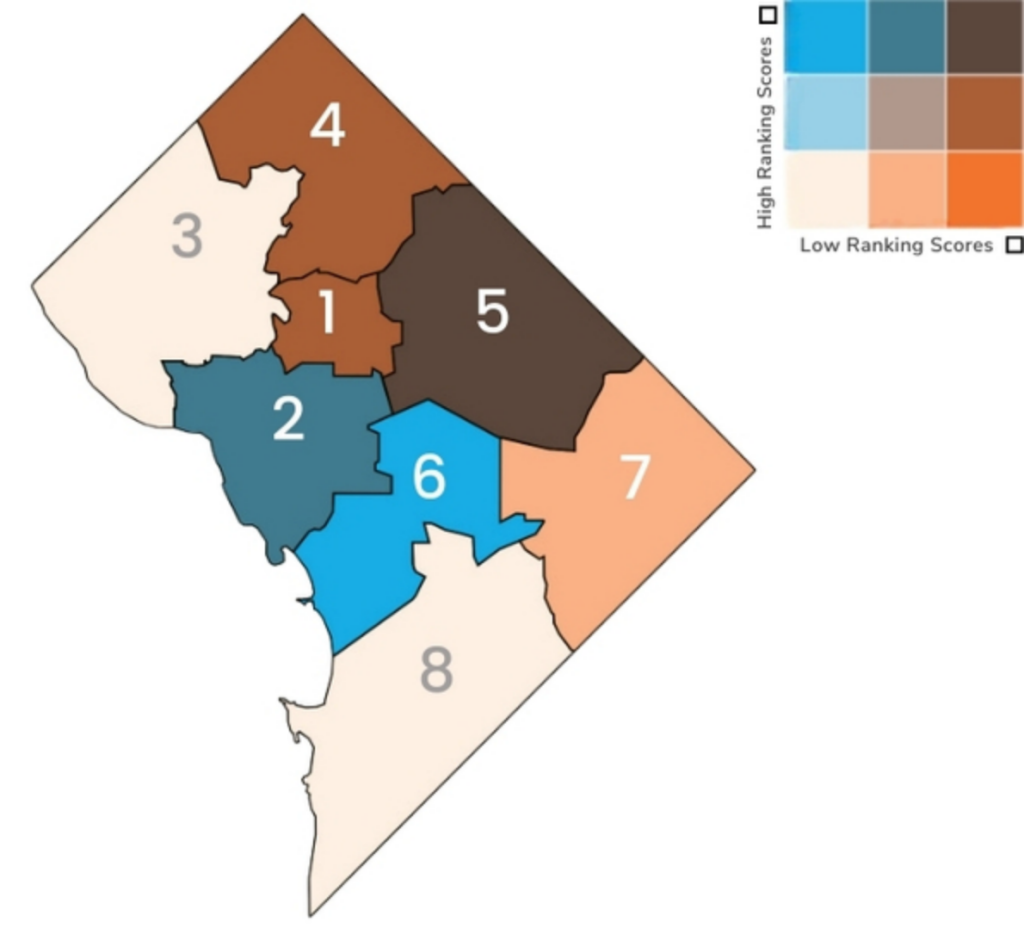
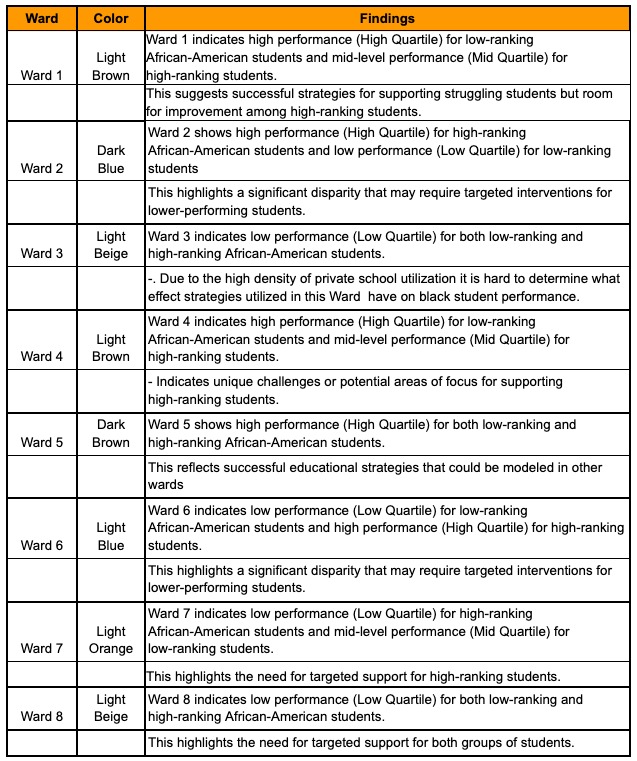
Figure 2.Bivariate of High Ranking vs Low Ranking African-American Students by Ward: Map showing the mean performance of low-ranking versus high-ranking Black students across different regions. The color gradient from blue to brown indicates high-ranking scores, while the gradient from beige to orange indicates low-ranking scores. The map highlights regional disparities in student performance, with distinct areas showing higher or lower mean scores based on the color coding.
Color Palette Interpretation
- Bottom-left (Light Beige): This color indicates areas with both low low-ranking and high-ranking student performance scores, representing wards where both groups are performing poorly.
- Top-left (Light Blue): This color indicates areas with low low-ranking but high high-ranking student performance scores, representing wards where low-ranking students are performing poorly, but high-ranking students are performing well.
- Bottom-right (Light Orange): This color indicates areas with high low-ranking but low high-ranking student performance scores, representing wards where low-ranking students are performing well, but high-ranking students are not.
- Top-right (Dark Brown): This color indicates areas with both high low-ranking and high high-ranking student performance scores, representing wards where both groups are performing well.
- Middle Shades: Intermediate shades represent varying levels of performance between these extremes.
Bivariate Analysis Findings
Overall, this bivariate choropleth map provides a comprehensive overview of the educational performance of Black students across different wards, highlighting areas of success and regions needing improvement. By understanding these patterns, stakeholders may better understand where and how resources should be distributed in order to reduce performance discrepancies.
Performance Gap Impact Areas
While comprehensively defining the school- and ward-based characteristics that contribute to the Black student performance gap in DC requires additional, nuanced research, we’ve identified a few measures that appear to contribute to students’ achievement, including teacher retention, teacher diversity, and chronic absenteeism.
Teacher Retention
Research from the Learning Policy Institute shows that frequent teacher turnover is correlated with poor student performance. High churn rates can lead to learning loss due to increased substitutes, canceled classes, and teaching positions being filled by underprepared teachers.
Indeed, DCPS data underscores what we already know: schools with stronger teacher retention tend to be schools with better student performance. While the relationship between teacher turnover and performance is a complex one, it’s worth noting that DCPS schools with an 80% or greater retention rate typically demonstrated student achievement student scores above 70. While teachers may be more inclined to stay in schools where students are more likely to achieve academically, their continued presence likely signals to students that their teachers care about them, which has been shown to contribute to students’ success.
Student Group Scores vs Teacher Retention Percentage:
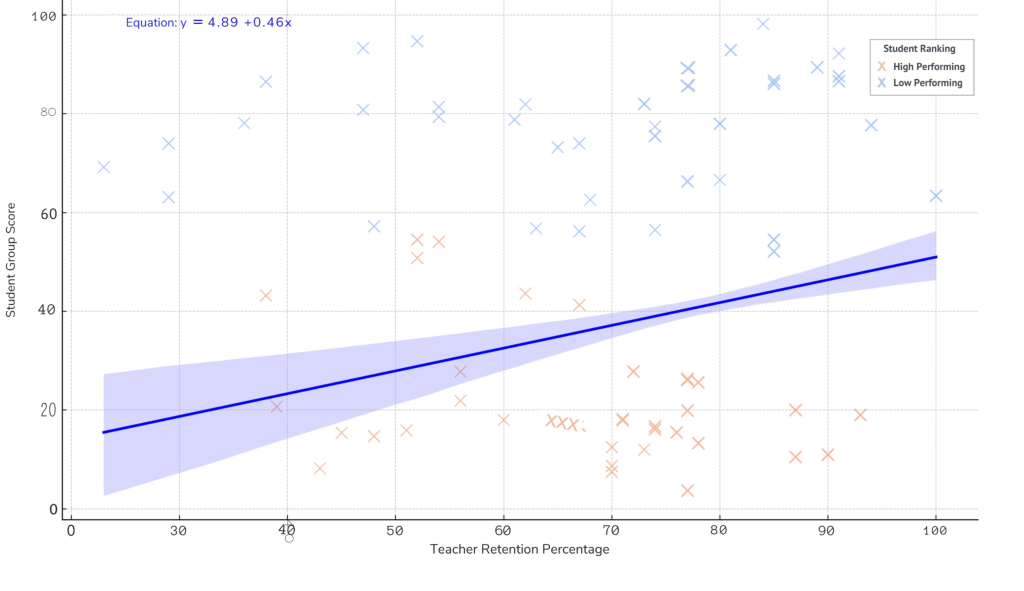 Figure 3. Student Group Scores vs Teacher Retention Percentage: Scatter plot showing the relationship between student group scores and teacher retention percentage. The blue trend line (𝑦=4.89+0.46𝑥) indicates a positive correlation, suggesting higher teacher retention is associated with higher student scores. The shaded area represents the confidence interval.
Teacher Diversity
In addition to faculty retention, faculty diversity is related to the Black student performance gap as well. Though typically used to assess diversity in ecological contexts, The Shannon Diversity Index (SDI) can also serve as a valuable tool for understanding the diversity of a teacher population by race. The SDI quantifies diversity by taking into account both the variety (richness) and the evenness of different categories within a dataset. For our purposes, these categories are the different racial groups of teachers within a school.
Plotting student performance scores against the SDI values for various schools and performing a regression analysis shows that schools with higher SDI values tend to have better student performance scores. As schools make decisions related to hiring and retention, it may be important for them to consider the role diversity plays in Black student performance.
Student Group Scores vs Teacher Shannon Diversity Index

Figure 4. Student Group Scores vs Teacher Shannon Diversity Index: Scatter plot illustrating the relationship between student group scores and the Teacher Shannon Diversity Index. The x-axis represents the Shannon Diversity Index, while the y-axis shows student group scores. Each orange dot represents a data point. The blue trend line (y=25.38+11.67x) indicates a positive correlation, suggesting that higher diversity among teachers is associated with higher student group scores. The shaded area around the trend line represents the confidence interval.
Chronic Absenteeism
Chronic absenteeism is one of the most difficult performance-associated challenges for school systems and administrators to address. While chronic absenteeism was an issue prior to the Covid-19 pandemic, recent data suggests that absenteeism has potentially doubled nation-wide in the pandemic’s wake.
Unfortunately, DC public schools experience some of the highest rates of chronic absenteeism in the country. During the 2021-2022 school year, 48% of DC public school students were chronically absent; that number dropped by 5% points the following school year, but absenteeism remains high at 43%.
While DCPS does not publish data on reasons for chronic absenteeism, Attendance Works identifies four root causes: barriers, aversion, disengagement, and misconception. Regardless of the reason for absenteeism, perhaps unsurprisingly, chronic absenteeism contributes significantly to the Black student performance gap in DC.
Student Group Scores vs Chronic Absenteeism (Black/African-American)
 Figure 5. Student Group Scores vs Chronic Absenteeism (Black/African-American) Scatter plot showing the relationship between student group scores and chronic absenteeism among Black/African-American students. The x-axis represents the percentage of the population absent, and the y-axis shows student group scores. Blue ‘X’s represent high-performing groups, while orange ‘X’s represent low-performing groups. The blue trend line (y=96.04−1.01x) indicates a negative correlation, suggesting higher absenteeism is associated with lower student scores. The shaded area represents the confidence interval.
The graph above highlights the significant negative impact of chronic absenteeism on student performance among Black/African-American student groups. Reducing absenteeism could potentially lead to substantial improvements in student group scores, making it a critical area for intervention to enhance educational outcomes and provide better opportunities for student success.
Interestingly, rates of chronic absenteeism and their effects on student performance vary widely by education level. The box plot below illustrates some of the differences in chronic absenteeism rates by educational level.
Chronic Absenteeism by Accountability Framework and Ranking

Education Level
Figure 6.: Chronic Absenteeism by Accountability Framework and Ranking. This box plot visualizes the distribution of chronic absenteeism rates across different types of accountability frameworks (High School, Middle School, Elementary School Without Pre-Kindergarten, and Elementary School with Pre-Kindergarten) and rankings (highest and lowest). The yellow boxes represent the highest-ranked schools, while the orange boxes represent the lowest-ranked schools.
In the highest-ranked high schools (yellow boxes), chronic absenteeism rates vary widely, with a median around 60%. This indicates that some top-performing schools still face attendance issues. In contrast, the lowest-ranked high schools (orange boxes) have higher absenteeism rates, with medians near 80%. This suggests a strong link between high absenteeism and lower school rankings.
The highest-ranked middle schools show much lower absenteeism rates, with a median around 20% and less variation, indicating consistent attendance. The lowest-ranked middle schools have a median absenteeism rate of about 40%, highlighting the significant impact of absenteeism on middle school performance.
In elementary schools without pre-kindergarten, the highest-ranked schools have a median absenteeism rate around 40%. The lowest-ranked schools in this category face higher absenteeism, with a median of 60%, indicating greater attendance challenges.
Elementary schools with pre-kindergarten programs show better attendance rates. The highest-ranked schools have a median absenteeism rate around 20%, while the lowest-ranked schools have a median around 40%. This suggests that pre-kindergarten programs may help improve attendance.
Overall, higher-ranked schools generally have lower rates of chronic absenteeism across all educational stages. High absenteeism rates in lower-ranked schools, especially in high schools and elementary schools without pre-kindergarten, highlight the need for targeted interventions designed to increase students’ regular attendance.
Recommendations
To decrease existing gaps in Black students’ performance across the District’s schools, we recommend that administrators use the bivariate choropleth map to gain a better understanding of how the Black student performance gap manifests uniquely in their own ward.
Though most districts are likely to already be prioritizing staff and teacher retention as a strategic initiative, the data herein underscores the importance of these efforts. Urban districts across the country are experimenting with a variety of strategies to retain staff, including expanded professional development opportunities, grow-your-own teacher pipeline programs, and sizable bonuses or salary increases.
In addition to ensuring that faculty are retained year-over-year, schools should look for ways to ensure students have access to a racially-diverse faculty with a variety of experiences and perspectives.
Finally, schools should prioritize the adoption of attendance-boosting strategies like parental engagement initiatives, increasing student mentorship, modernizing record-keeping practices, and creating attendance incentives to reduce absenteeism and support student success.